A topographic map, in simple words, is a two-dimensional representation of a portion of the three-dimensional surface of the earth. Topographic maps exist, to represent land surfaces. They are used in Geologic studies, as they show you the configuration of the earths surface. A lot of you will have topographic maps in your syllabus, when you are in high-school, so it's best to understand and learn the basics from now, so you are not confused when you have been taught about these maps.
When first looking at a topographic map, it may appear somewhat confusing and not very useful. There are a few rules that topographic contours must obey, however, and once you understand these rules the map becomes an extremely useful and easy to use tool. So, lets begin...
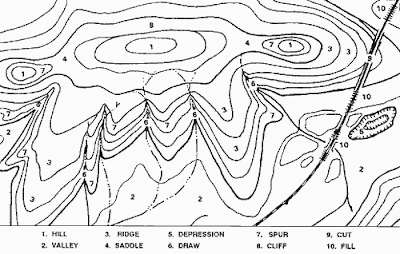
Contour Lines:
Topographic Maps are like children's drawings, if you don't understand what contour lines are. Contour lines are all over the map and understanding them are the key to understanding Topographic Maps.
The thin brown lines snaking around a topographic map are called contour lines. All points along the same contour line are at the same elevation above sea level. Think of a contour line as a closed loop. By following a contour line on the ground, you would travel neither uphill nor downhill, eventually ending up back at your starting point. A line marked "6500," for example, means that point on the map is 6,500 feet above sea level. Be careful, however: Because contour lines are measured in regular intervals, you can find a wide elevation variation in the terrain between two contour lines.
Rules to understand Topographic Maps:

Also, you can check out our Facebook page for videos, pictures and really cool articles at www.facebook.com/SkoolShop and follow us on twitter at @Myskoolshop
When first looking at a topographic map, it may appear somewhat confusing and not very useful. There are a few rules that topographic contours must obey, however, and once you understand these rules the map becomes an extremely useful and easy to use tool. So, lets begin...

Contour Lines:
Topographic Maps are like children's drawings, if you don't understand what contour lines are. Contour lines are all over the map and understanding them are the key to understanding Topographic Maps.
The thin brown lines snaking around a topographic map are called contour lines. All points along the same contour line are at the same elevation above sea level. Think of a contour line as a closed loop. By following a contour line on the ground, you would travel neither uphill nor downhill, eventually ending up back at your starting point. A line marked "6500," for example, means that point on the map is 6,500 feet above sea level. Be careful, however: Because contour lines are measured in regular intervals, you can find a wide elevation variation in the terrain between two contour lines.
Rules to understand Topographic Maps:
1. Contour lines never cross.
2. When a contour line crosses a river (stream) the contour line forms a "V". The "V" always points upstream. Look at the Cinder River in the diagram below and observe how the contour lines "V" toward the top of hill A. This tells you which direction the river is flowing. Remember water flows toward the lowest elevation.
3. The slope (gradient) is steepest when the contour lines are close together and gradual when they are far apart. The right side of hill A is steeper because the contour lines are much closer together.
4. Contour lines form circles or are lines that go to the edge of the map. The higher elevations on a map are found where the contour lines make smaller closed circles. See hill A on the map below.
5. A depression on a contour map is shown by contour lines with small marks pointing toward the lowest point of the depression. The first contour line with the depression marks (see hill B) and the contour line outside it have the same elevation. Based on the contour interval for this map the elevation of the first contour line with depression marks is 60 meters.
The map below shows elevations in meters and the top edge of the map points north. Use the scale below the map to measure distance on the map . This landform is an island in the ocean.

We hope you could understand topographic maps.
Also, you can check out our Facebook page for videos, pictures and really cool articles at www.facebook.com/SkoolShop and follow us on twitter at @Myskoolshop
Brought to you by : www.skoolshop.com/
Come back again tomorrow!
No comments:
Post a Comment